Classifying Curiosity Rover Images
In collaboration with Emily Mader, Sarah Son, Peter Le and Will Yang
The Decision
Judge the classifier on macro-F1 across rare classes instead of headline accuracy.
Takeaways
- Class weighting took the final model to 76.5% accuracy and 0.666 macro-F1 on held-out images.
- Performance tracks how distinctive a class looks. Class size has no measurable effect.
- Under simulated dust on the optics, accuracy falls by 4.2 points.
Autonomous navigation on Mars depends on the rover recognising what it sees. We trained a three-stage transfer learning pipeline on ResNet-50 to classify images from Curiosity’s onboard cameras across 25 label classes. They cover surface features such as ground and horizon, instruments such as the drill and scoop, and the calibration targets each instrument carries.
Our central claim was that overall accuracy is a misleading metric for planetary data. That holds up. Going back through the held-out predictions turned up two more findings the original report does not make, and both are below.
Source code: github.com/olivia-jackson-lambert/mars-project
The Data
Stanboli and Wagstaff at NASA collected the dataset in 2017 from three of Curiosity’s cameras. It has 6,691 labelled images. Aspect ratios vary, up to 3.0, so we padded each image by reflection to a 256 by 256 square. Stretching would have distorted the instrument shapes the model needs to read.
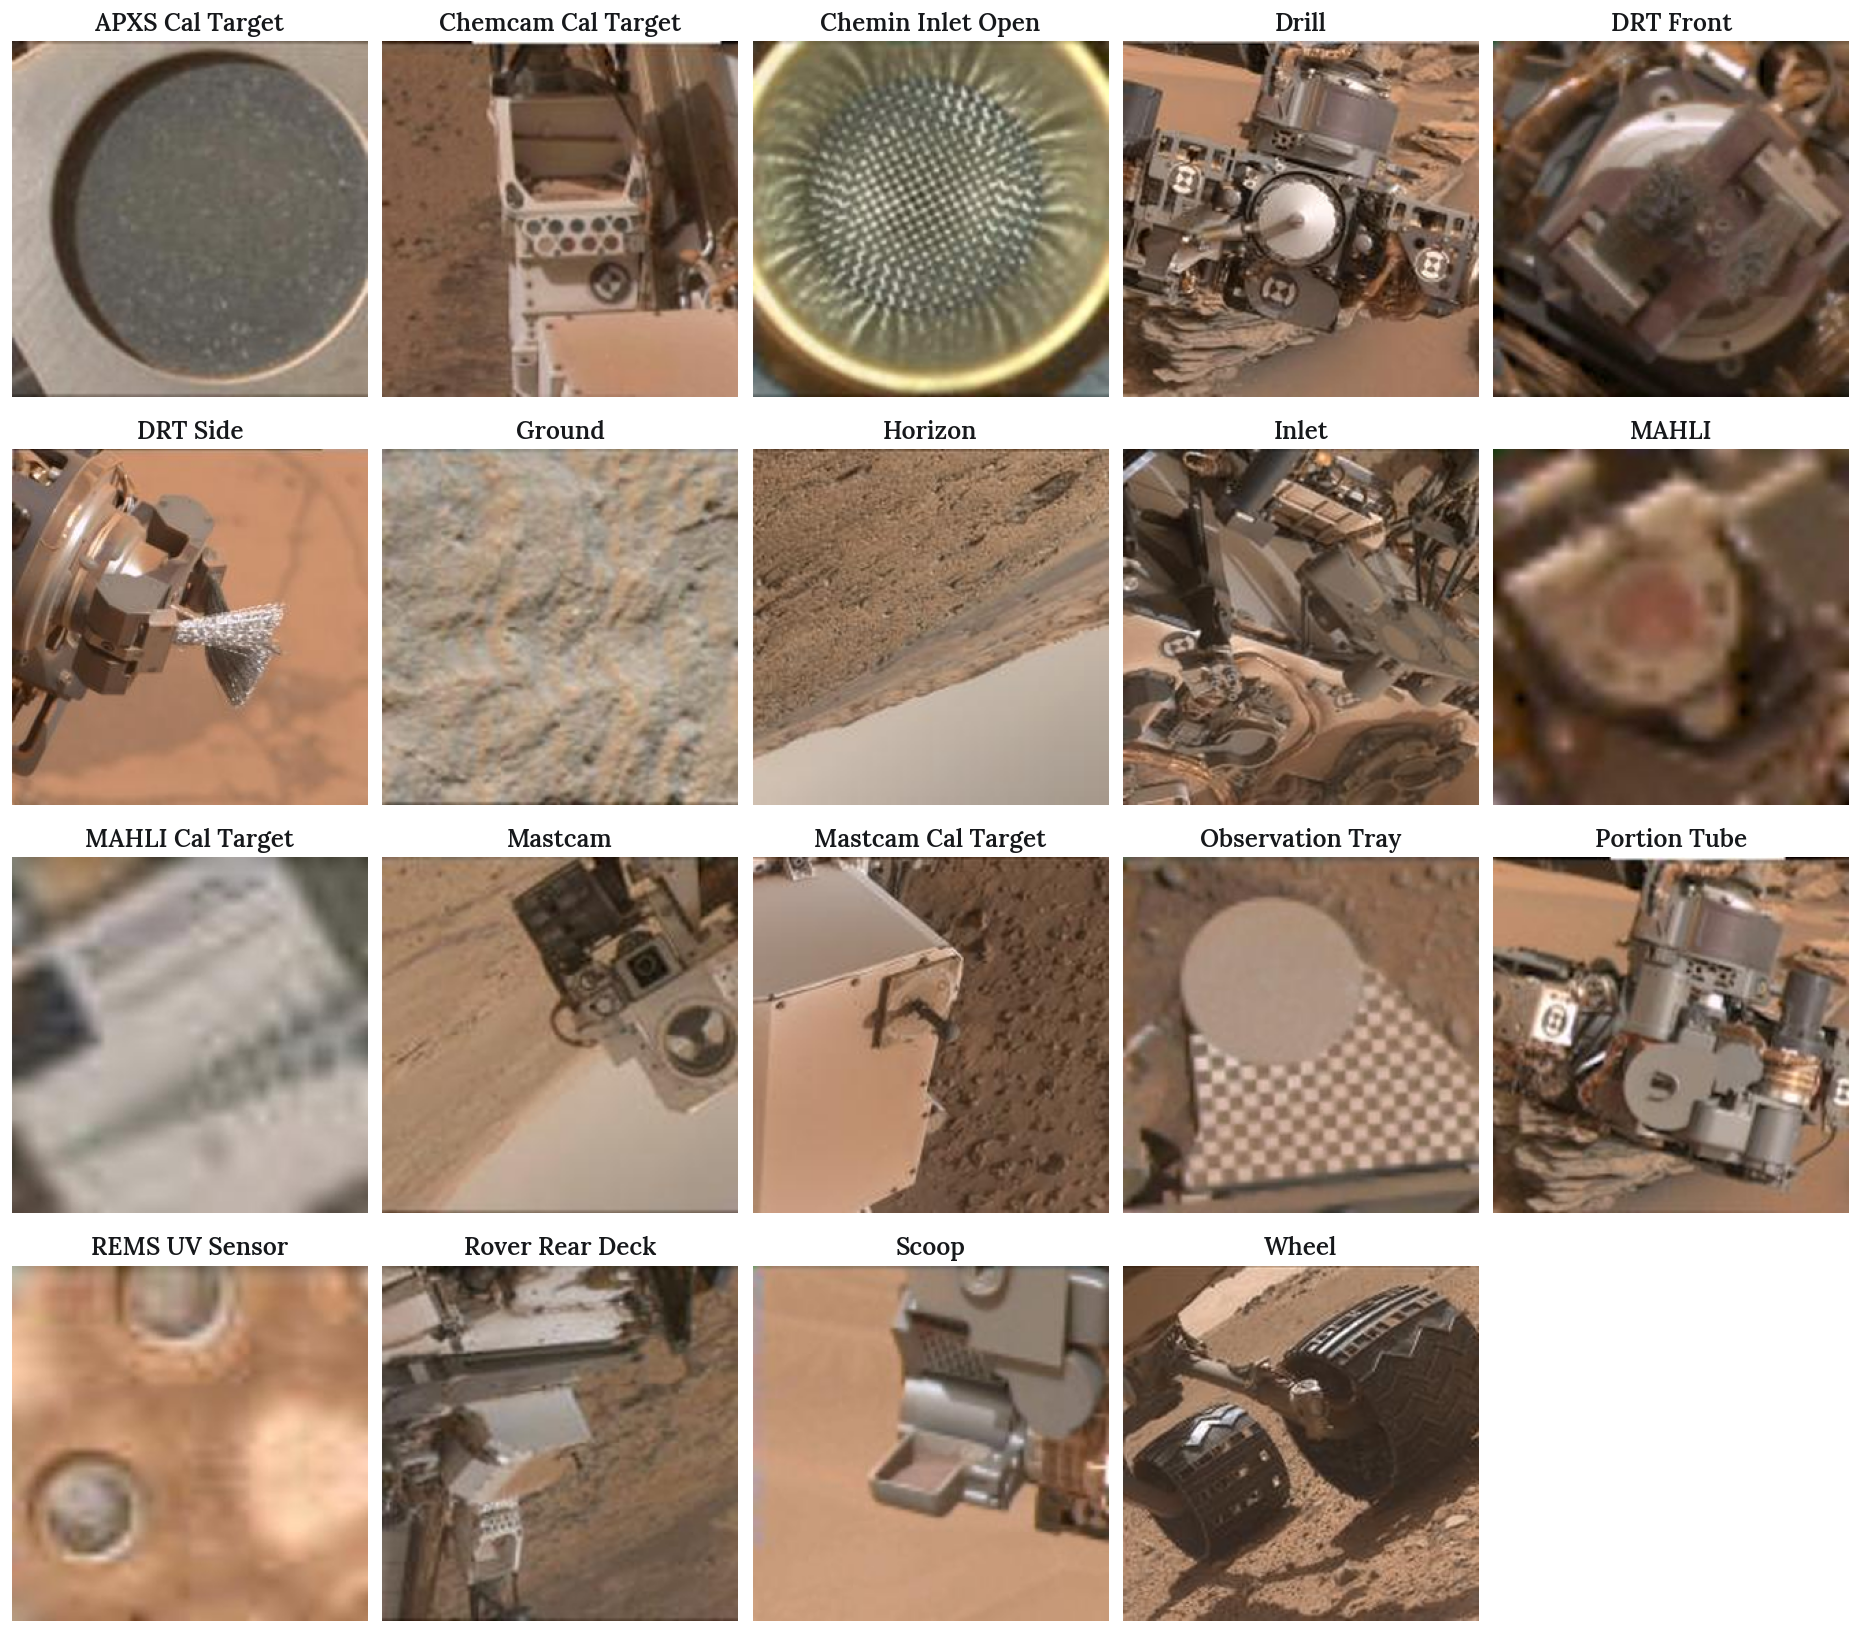
Three classes have no examples in the held-out test split: Drill Holes, Sun and Turret. This affects how the headline score is computed, covered further down. Three more (APXS, Portion Box and Portion Tube Opening) have no image file in the archive, so the grid shows 19 of the 22 classes the test set measures.
The grid shows why the task is hard. The calibration targets, with their circles and machined edges, look like nothing else in the set. The drill, the DRT, the scoop and the inlet are all grey metal photographed against the same sand at a similar scale.
The Pipeline
Each stage loosens the one before.
Stage 1, frozen backbone. ResNet-50, pretrained on ImageNet, with every convolutional weight fixed and only a new classifier head trained. This shows how far generic visual features get on Martian imagery with no adaptation.
Stage 2, partial unfreezing. We unfroze the final convolutional block, conv5, so the network could adapt its highest-level features to Martian textures. Validation accuracy rose sharply, to 0.968.
Stage 3, class weighting. The same architecture as Stage 2, with the loss weighted by inverse class frequency and model selection switched from accuracy to macro-F1. This stage stops the model from quietly ignoring rare classes.
Results
| Stage | Test accuracy | Test macro-F1 |
|---|---|---|
| Majority-class reference (always predict Wheel) | 0.2299 | |
| Stage 1, frozen backbone | 0.7172 | 0.6047 |
| Stage 3, class weighted | 0.7648 | 0.6656 |
The notebooks never printed Stage 2’s test figures, only its 0.968 validation accuracy, so we left it out of the table instead of estimating it.
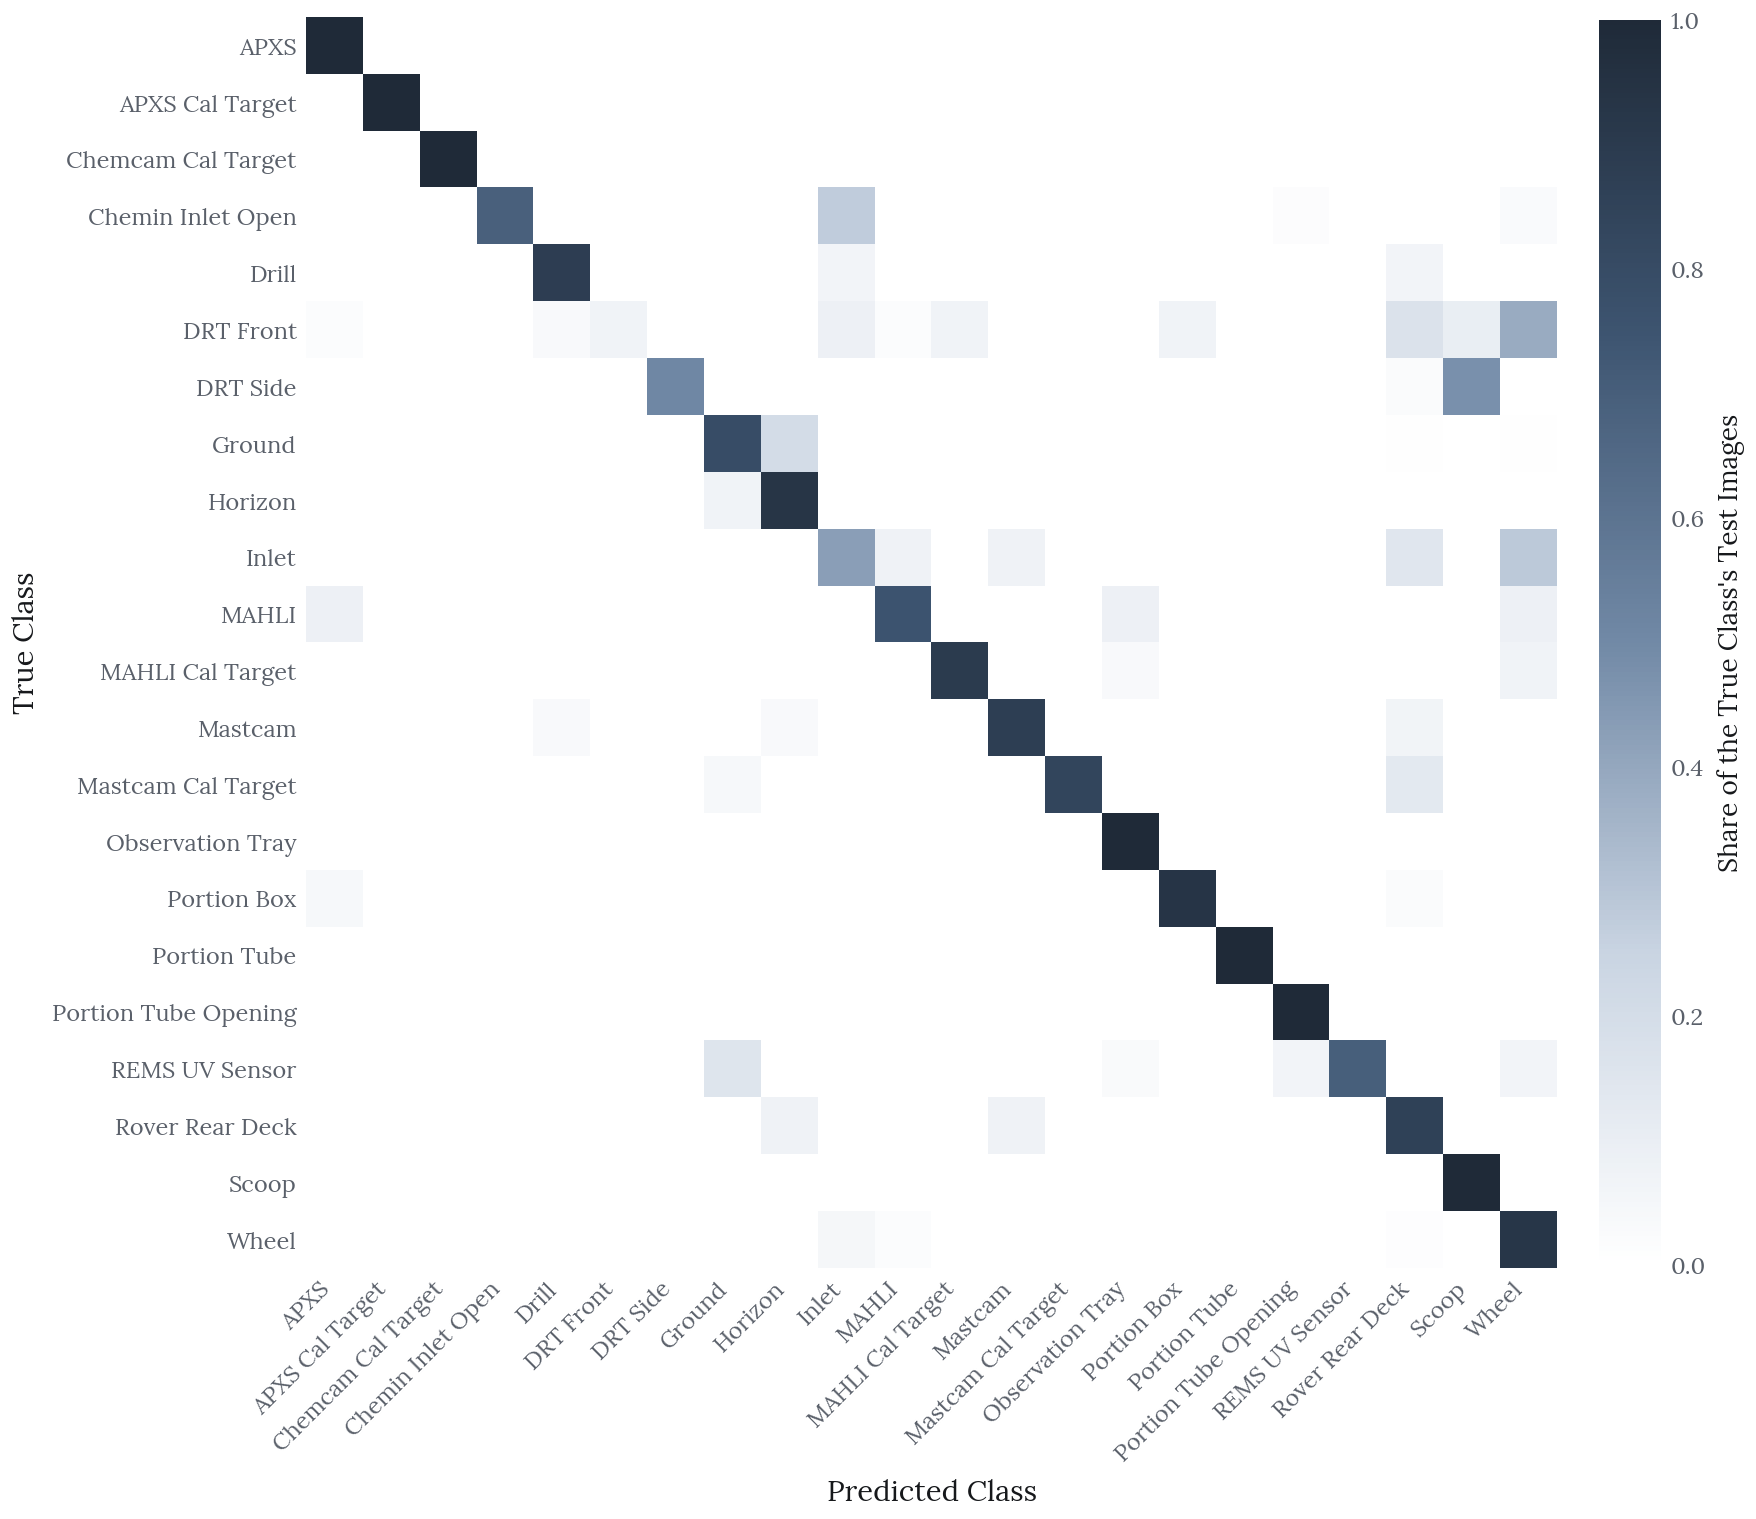
Stage 2’s 0.968 was measured on validation data and chosen on accuracy. A model selected that way can look excellent while doing badly on the rarest classes. Stage 3 selects on macro-F1, which weights every class equally, and its 0.765 test accuracy is the more honest number.
Where the Headline Number Comes From
Macro-F1 is the average of per-class F1 scores. Which classes go into that average is a choice, and here it moves the result a lot.
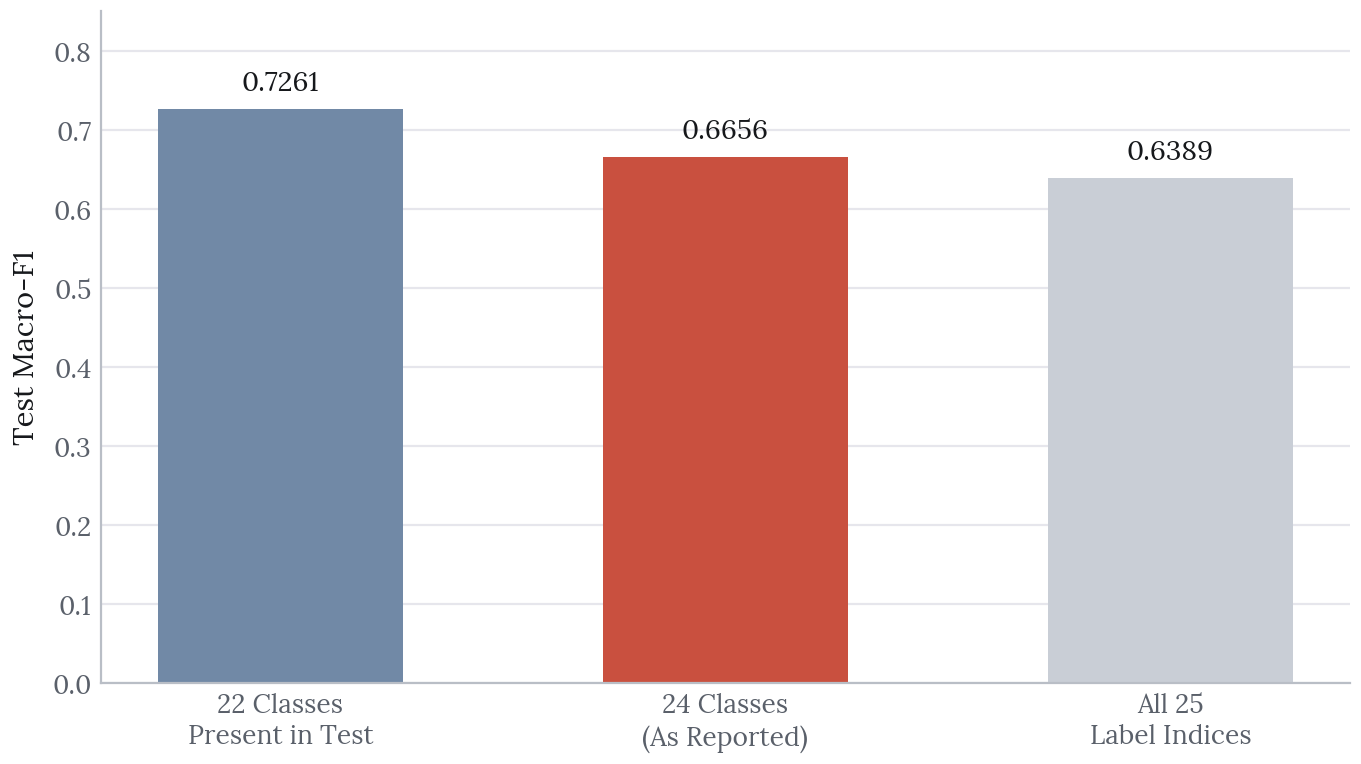
Drill Holes, Sun and Turret have no test examples. The model still predicts two of them occasionally, which pulls them into scikit-learn’s default label set. Each then scores an F1 of exactly zero and drags the mean down.
| Classes averaged | Macro-F1 |
|---|---|
| The 22 classes present in test | 0.7261 |
| 24 classes, the default and the reported figure | 0.6656 |
| All 25 label indices | 0.6389 |
The model is identical in all three rows. The figure of 0.7261 better describes performance on the classes the test set can measure, and the reported 0.6656 understates it by about 0.06. Either number is defensible if the class set is stated next to it. The original report did not state it.
Class Size Is Not the Problem
We framed the difficulty as class imbalance. The held-out predictions do not support that.
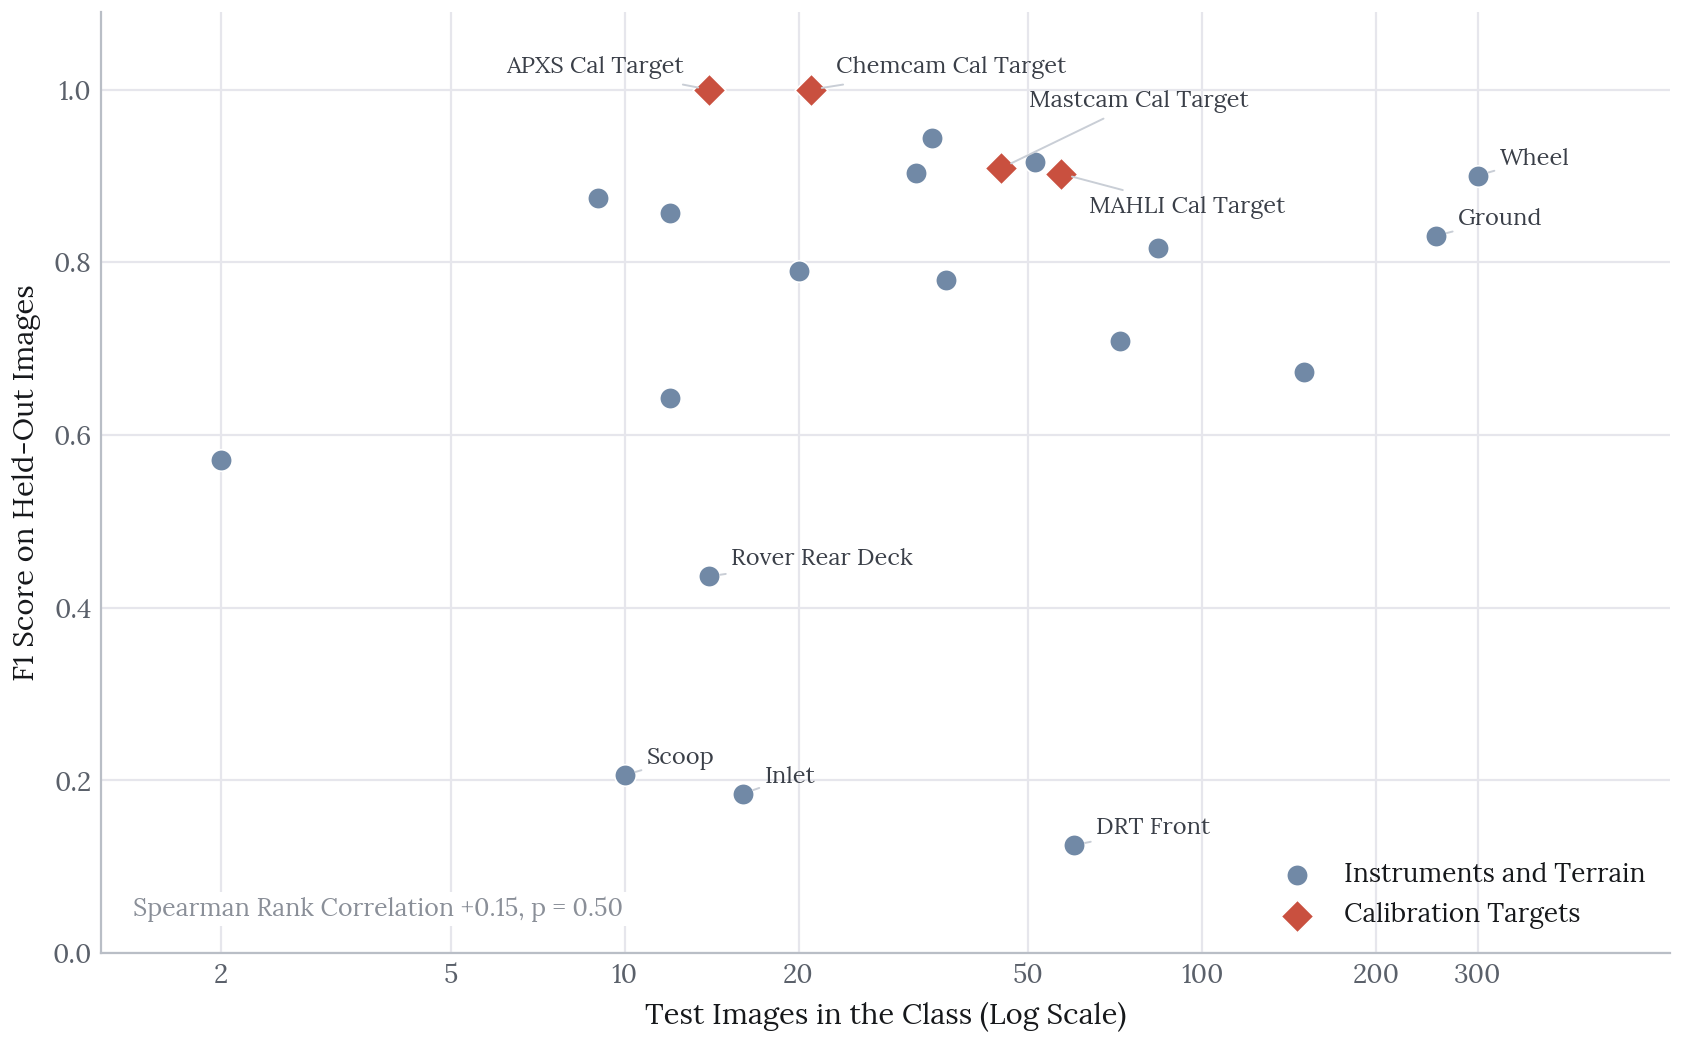
Across the 22 classes with test examples, the rank correlation between class size and F1 is +0.15 (p = 0.50). There is no relationship. DRT Front has 60 test examples, more than all but five other classes, and scores an F1 of 0.125. APXS Cal Target has 14 and scores a perfect 1.000.
What the object looks like predicts performance much better.
| Group | Mean F1 | Mean test examples |
|---|---|---|
| Calibration targets | 0.953 | 35 |
| Instruments and terrain | 0.676 | 65 |
Calibration targets score far higher while being rarer on average. That makes sense. A calibration target is built to be visually unambiguous, because its job is to be recognised under changing light. The drill, scoop, DRT and inlet are metal instruments shot against the same sand at the same scale, and they really do resemble each other.
Our SAM-2 analysis reached the same conclusion from another direction. On DRT Side images misclassified as Scoop, masking individual regions never shifted the prediction by more than 0.002. No single region carried the error. The two instruments simply look alike as a whole.
Class weighting fixed the first problem we saw, which was rare classes going undetected. It cannot fix confusion between classes that look the same.
Dust Robustness
Rover optics collect dust. A model that only works on clean images is of limited use over a mission.
We applied simulated dust to the held-out test images and re-scored the Stage 3 model without retraining.
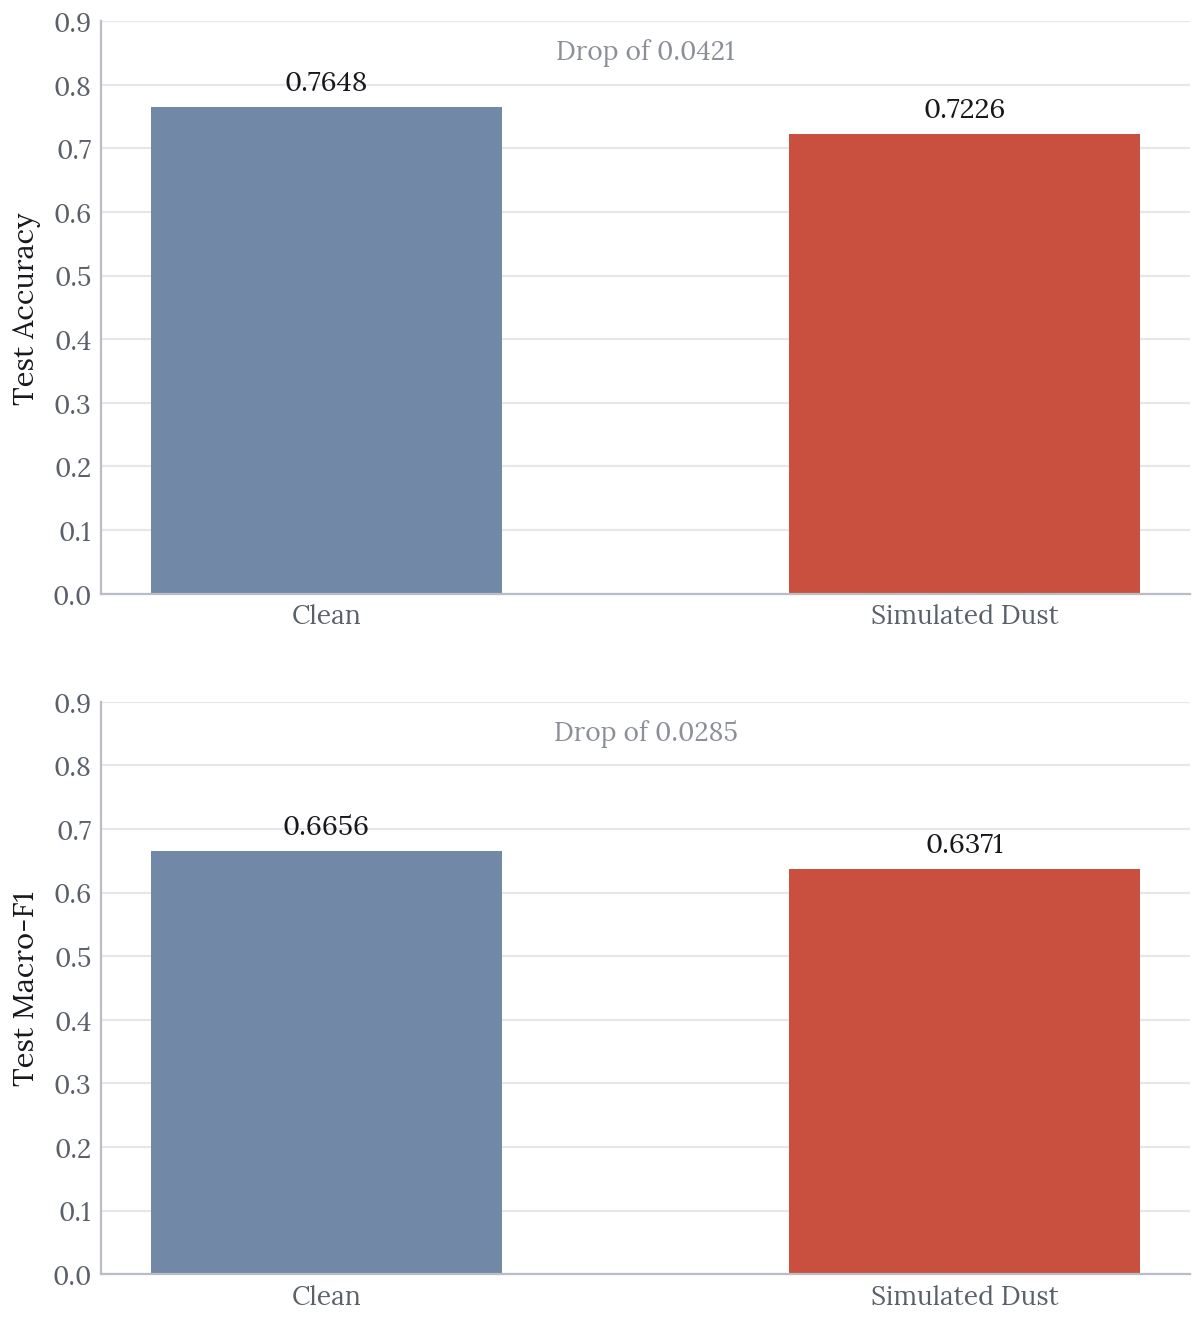
| Condition | Accuracy | Macro-F1 |
|---|---|---|
| Clean | 0.7648 | 0.6656 |
| Simulated dust | 0.7226 | 0.6371 |
| Drop | 0.0421 | 0.0285 |
Accuracy falls by 4.2 points and macro-F1 by 0.029. Dust does hurt. Still, 72.3% accuracy on degraded images, from a model trained only on clean frames, is a reasonable result.
Two caveats. The dust is synthetic, a filter applied after capture, so it models the loss of contrast but not the scattering or wavelength effects of real Martian dust. Macro-F1 also falls proportionally less than accuracy. The rare classes are not hit harder by dust, so what the model learned about them holds up at least as well as the rest.
Limitations
No test metrics for Stage 2. The middle stage is missing its held-out numbers, so we can only show the progression from Stage 1 to Stage 3.
Three classes cannot be measured. Drill Holes, Sun and Turret have no test examples. We cannot say whether the pipeline helped them, which is a real gap when rare-class detection is the stated goal.
The label space does not reconcile. The source dataset is documented as having 24 classes, the model’s output layer has 25 indices, and 22 appear in test. The notebooks do not explain the difference.
Dust is simulated. Real dusty-lens images would be a stronger test.
Next Steps
Target confusable classes directly. The evidence points to similar-looking instrument pairs. Metric learning, or a hierarchical classifier that first separates terrain from hardware and then tells instruments apart, would address the actual failure.
Report macro-F1 with its class set. Or restrict evaluation to classes the test split can measure, and say so.
Train on degraded images. The dust analysis measures robustness but nothing in the pipeline builds it. Dust augmentation during training would show whether the 4.2 point drop can be closed.
Rebalance the test split. A class with two test examples cannot support a stable F1 estimate. A stratified split would make rare-class claims checkable.